IHE Enrollment Trends: HS Graduates Direct Enrollment
In our previous post, broad trends related to K-12 enrollment and high school graduates were explored at both the national and state of Texas levels (IHE Enrollment Trends: K-12 and HS Graduates). The national data showed that the growth in high school graduates during the past few decades began flattening with the 2013 graduating class, before a projected spike in 2025 with a dramatic fall-off through the mid-2030s. The story for high school graduates in Texas is different than the national context, with Texas predicted to lead the nation with an increase of more than 56,000 high school graduates from 2014 to 2032. These trends have led to Texas being in the top-3 for negative net-migration of first-time-in-college students in the past decade. In fall 2018, the number of in-migration students coming to Texas increased to 16,923, while the out-migration of Texans swelled to 32,276, leaving Texas with a negative net-migration of -15,353.
This post extends the previous presentation by examining direct enrollment of high school graduates in Texas at Texas public and independent institutions, and comparing the state-level trends to what is occurring nationally.
High School Graduation Trends
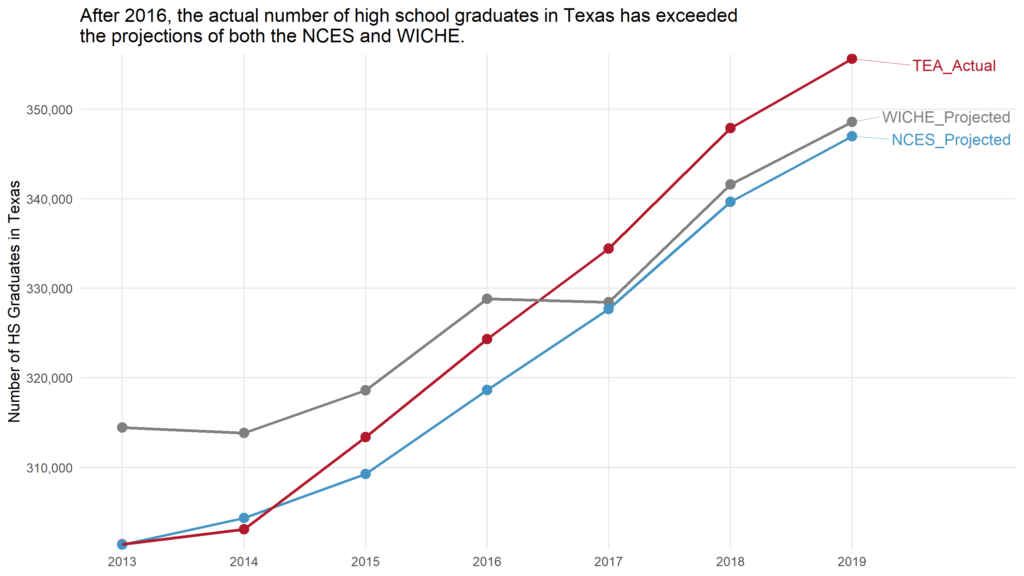
Two of the primary sources for nation- and state-level trends in high school graduates are the National Center for Education Statistics (NCES, Digest of Education Statistics) and the Western Interstate Commission for Higher Education (WICHE,Knocking at the College Door). Both of these entities track historical data for high school graduation counts and rates using data available from NCES, and they both postulate predictions for how many students will graduate in the future (NCES, WICHE).
Based on data from the Texas Education Agency (TEA), Texas high schools graduated 292,636 students during the 2011-2012 academic year, while 355,615 Texans graduated high school during the 2018-2019 academic year. This increase in less than a decade represents a 21.5-percent growth in the number of high school graduates in Texas. As shown in the figure below, when compared to the projections made by NCES and WICHE, Texas has exceeded projections by both entities in each of the last three years, and has been above the NCES projections since 2015.
Direct Enrollment in Texas IHEs
While Texas is leading the nation in the growth of high school graduates, there is another trend that should be more disconcerting to higher education stakeholders: the decreasing percentage of direct enrollment of Texas high school graduates into Texas public institutions of higher education (IHEs). The Texas Higher Education Coordinating Board (THECB) recently updated data tracking graduates from Texas high schools to IHEs in the state with fall 2019 data. As defined by THECB, “Data for Texas high school graduates from each academic year, that enrolled in Texas public or independent higher education in the following fall, are provided by high school county, school district, and high school” (Texas Higher Education Data). In order for a high school’s data to be included in the THECB data, the high school must have more than 25 graduates in a reporting year. This definitional difference results in slightly different data from what TEA reports.
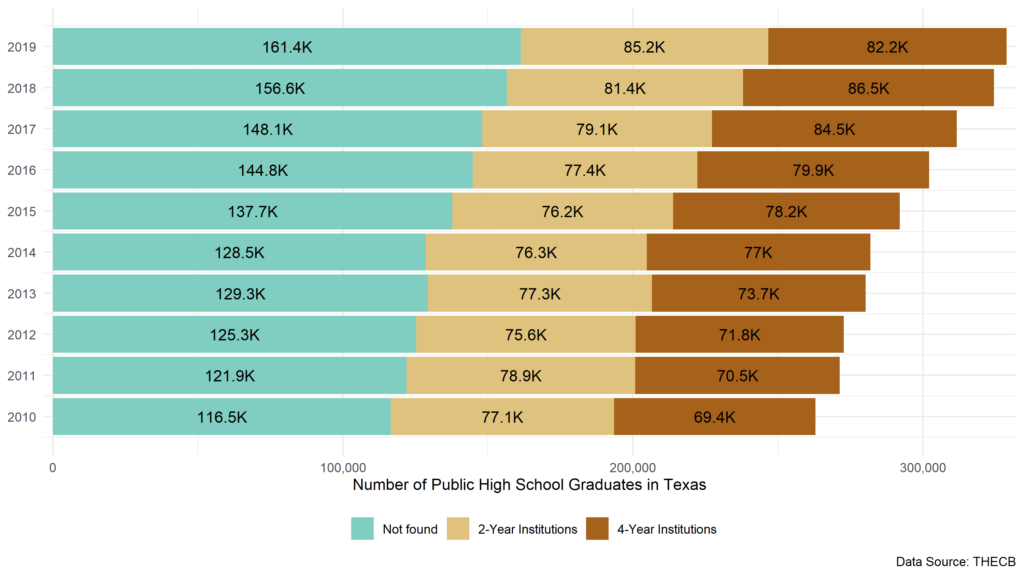
In the figure below, you can see that both the number of high school graduates and the number of direct enrollees in Texas have increased, albeit at different rates. The THECB data, which include high school graduates who can be tracked into the following fall semester post-graduation, shows that high school graduates have increased from 262,984 in 2010 to 328,816 in 2019, a 25-percent increase. The number of high school graduates who directly enroll in Texas public colleges and universities has increased from 146,490 in 2010 to 167,394 in 2019, a 14-percent increase.

The THECB data, which are disaggregated by high school campus, district, and county, show the number of students from each high school who enroll in a Texas public or independent college or university, as long as there are more than 5 students from that high school enrolling in the specific IHE campus. All instances where a high school campus has fewer than 5 enrollees are aggregated into the “Other Public/Independent 4-yr Institution” or “Other Public/Independent 2-yr Institution.” The count of students who do not enroll in a Texas public IHE, but have a standard, trackable identification number, are aggregated into the “Not found” category.
The figure below shows the last decade of THECB data “binned” into three categories: Not found, 2-Year Institutions, and 4-Year Institutions. For each category, the total is superimposed in the center of the respective bar segment, as the annual total across all three categories is the aggregation of the three segments. Broken out by category, the changes from 2010 to 2019 are as follows:
Not found
- 44,928 more students in 2019 (161,422) compared to 2010 (116,494) for a 39-percent increase.
- Students in the Not found category accounted for 44.3 percent of the total in 2010, and the percentage increased to 49 percent in 2019.
- 8,163 more students in 2019 (85,220) compared to 2010 (77,057) for an 11-percent increase.
- Students in the 2-Year Institutions category accounted for 29.3 percent of the total in 2010, and that percentage decreased to 25.9 percent in 2019.
- 12,741 more students in 2019 (82,174) compared to 2010 (69,433) for an 18-percent increase.
- Students in the 4-Year Institutions category accounted for 26.4 percent in 2010, and that percentage decreased to 25 percent in 2019.
So what?
What becomes evident quickly when looking at these trends is that the direct enrollment rate of Texas high school graduates into Texas colleges and universities is declining, which should be a concern to higher education stakeholders in Texas.
Working from top-to-bottom in the figure below, the blue line presents the national average for the percentage of high school graduates enrolling directly into a college or university. For the past decade, the national average has remained between 65 and 70 percent. In four of the past five years, the national direct-enrollment rate has exceeded 68 percent and has not fallen below 65 percent in more than 15 years based on data published by NCES.
The second line (red) shows the overall (in-state and out-of-state) direct-enrollment rate for Texas high school graduates. The source for these data, NCES’s Integrated Postsecondary Education Data System (IPEDS), only requires that institutions submit “Residence and Migration of First-time Freshmen” data in fall semesters occurring during even years. Therefore, the middle lines in the plot below includes only data points from fall semesters in 2010, 2012, 2014, 2016, and 2018. From 2010 to 2014, Texas’s overall direct-enrollment rate increased from 63 percent to just above 65 percent, before falling to below 62 percent in 2018.
The third line (green) from the top shows the “Texas In-State Rate (NCES)” of Texas high school graduates who enrolled in Texas colleges and universities during the fall semester after high school graduation. These data, based on IPEDS data that are submitted by institutions, show a similar trend to the “Texas Overall Rate” line in red, albeit approximately 7 percentage points lower across the years.
The bottom line (black) in the plot shows the “Texas In-State Rate (THECB)” as calculated by the THECB. This line shows that over the past decade, direct enrollment in Texas colleges and universities has dropped from just above 55 percent in 2010 to just below 51 percent in 2019.
In comparing the NCES (green) and THECB (black) lines, there appears to be a discrepancy between the two calculations. Much of the differences can be explained by differences in reporting requirements/definitions of the THECB and NCES. When the THECB matches Texas high school graduate data with enrollment files from Texas colleges and universities, they utilize a unique student identifier that is intended to link student information across data sources and domains. However, student records with invalid identification numbers are classified and reported by THECB as “Not trackable,” and are therefore not included in any enrollment rate calculations. On the other hand, the IPEDS data are submitted by each college or university, who utilize their own methods of identifying student geography of origin, thus increasing the “knowledge rate” of student records when aggregating data for IPEDS reports.
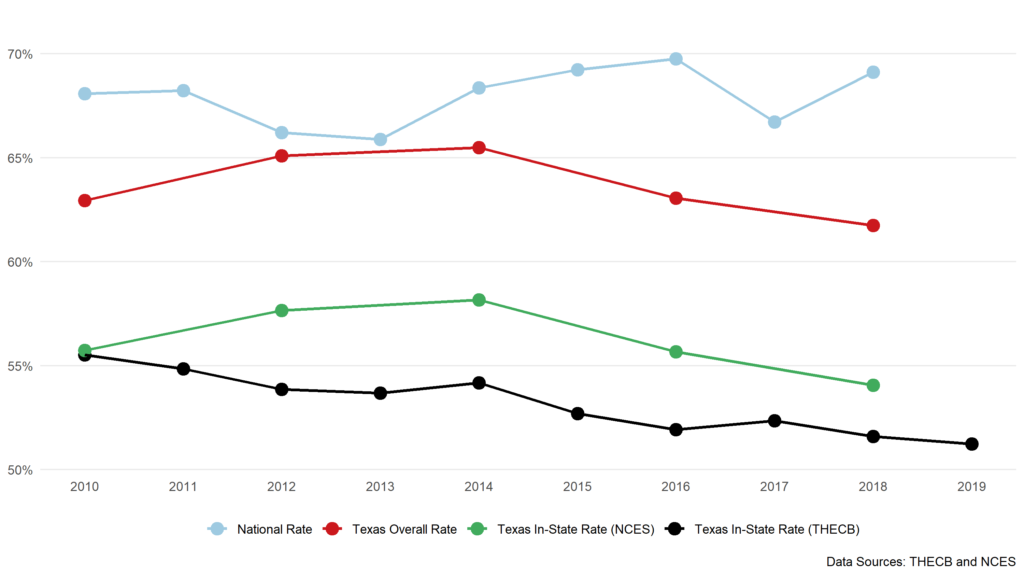
Regardless of the source, there is a clear downward trend in the past five years (NCES data) and decade (THECB) data when looking at the direct-enrollment of Texas high school graduates into institutions of higher education.
- While Texas is trending upward in producing high school graduates, what is contributing to the decline in those graduates enrolling directly in Texas IHEs?
- What is occurring in other states that are contributing to almost 70 percent of high school graduates nation-wide enrolling in a 2-year or 4-year institution the fall semester after they graduate from high school?
- What should higher education stakeholders, including colleges, universities, policymakers, business leaders, be doing to reverse this downward trend within the state?
The answers to these and other tangential questions will profoundly affect the economic, social, and political landscape of Texas in the decades ahead.
Next in the series
In October, we will turn our attention to trends related to adults in Texas who have earned some college credits, but do not have a bachelor’s degree. Using American Community Survey (ACS) data published by the US Census Bureau, we will use geographic data to explore this vitally-important segment of the population that often includes many individuals from underserved populations.
2 Comments
Excellent information. I wonder what trends in other states look like. We have experienced a number of good out of state institutions coming to recruit in the Panhandle.
Thank you for your feedback, Dr. Wendler. There certainly is a trend where more out-of-state universities are recruiting Texans to attend their institutions. I am working on additional data products to support the higher-level data discussed in these blog posts which will allow for further exploration and drilling-down to identify trends. I will be making those available as soon as possible.
Comments are closed.