IHE Enrollment Trends: K-12 and HS Graduates
Enrollment in institutions of higher education (IHEs) has been a topic of interest for stakeholders for as long as colleges and universities have existed. The current uncertainties surrounding the full effects of COVID-19 on enrollments have only heightened the concern about near- and long-term struggles facing public IHEs who are growing increasingly dependent on student tuition and fees to off-set declining per-student state support (Education Next, Forbes). Historically, direct enrollment of high school graduates has been one of the primary mechanisms for colleges and universities to either increase overall headcount or mitigate losses in other enrollment streams (new transfers, continuing students, and graduate students). This traditional pathway presents a number of challenges for IHE enrollments, several of which we explore below.
K-12 Enrollment: The National Context
The National Center for Education Statistics (NCES) annually publishes its Digest of Education Statistics that includes data tables spanning the educational life cycle. Of specific import in the context of this blog post is Table 105.20. Enrollment in elementary, secondary, and degree-granting postsecondary institutions. Based on the most recent data from 2019, enrollment in K-12 public and private schools in the United States grew from 46.9 million in 1990 to 56.4 million in 2017, representing a 20-percent increase during that span. However, the NCES predicts K-12 enrollment will remain between 56.3 and 56.5 million from 2018 to 2028 before rising slightly to 56.8 million at the end of the decade. At the high school level, nation-wide enrollments are predicted to peak at almost 17.3 million in 2023 before falling steadily until 2029, where the prediction of 16.5 million students would be below 2017 enrollment levels. The lack of growth in the number of students enrolled in K-12 schools through the 2020s is a key leading indicator of trends for higher education enrollment into the decade to come.
High School Graduates: Texas within the National Context
Direct enrollment of high school graduates into colleges and universities is another indicator of the health of IHE enrollments. The Western Interstate Commission for Higher Education’s (WICHE) quadrennial report, Knocking at the College Door, provides broader context to the state of high school graduates across the country. WICHE’s report uses aggregated historical data to make predictions for high school graduation trends at the national, regional (northeast, midwest, south, and west), and state levels for overall student populations at both public and private high schools. The data are also disaggregated by sex and race/ethnicity at public high schools. The most recent Knocking at the College Door report was published in December 2016, with an update scheduled to be published at the end of 2020.
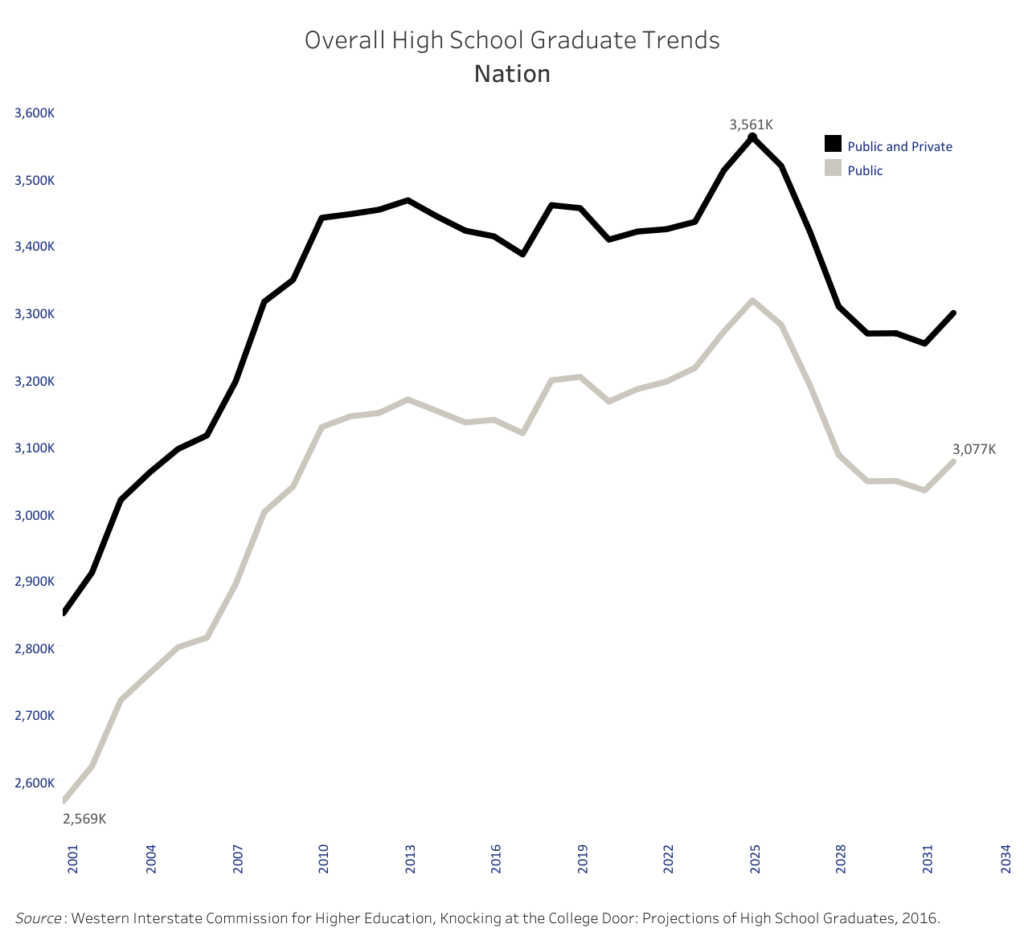
The figure below shows the national trends by Public and Private high schools combined (black, top line), and with Public high schools only (gray, bottom line). In general, the high point of high school graduates nationally occurred in 2013 with 3.47 million graduates. The overall count of high school graduates is projected to remain below 2013 levels until 2024, with a precipitous drop occurring after the peak in 2025.
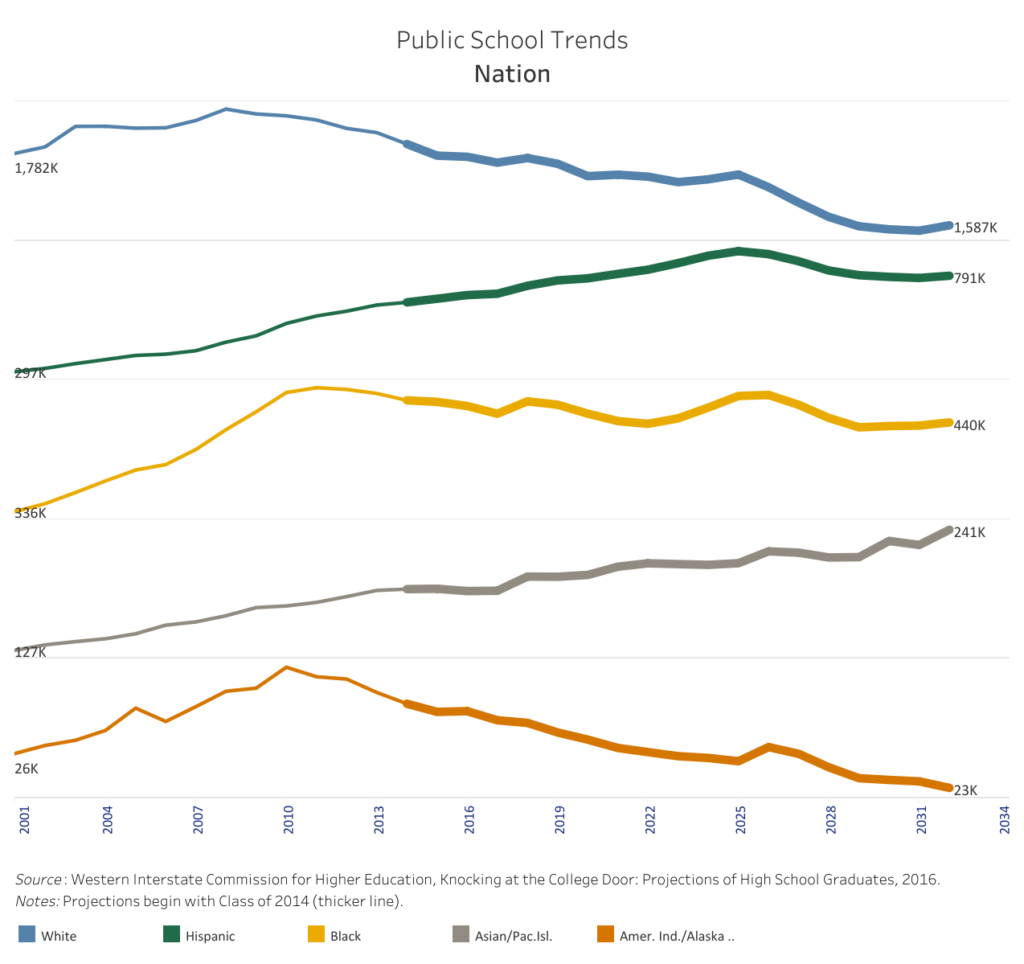
Due to the lag in data available when the report was published in 2016, historical data were used through 2013 for public high schools, with projections starting in 2014. As shown in the figure below, the number of Hispanic students (green line, second from the top) graduating from public high schools is projected to increase through 2025, with a slight dip through 2032. The only group that shows continual increases through 2032 is Asian/Pacific Islander students (gray line, fourth from the top), almost doubling the number of high school graduates from 2001 to 2032. Black students (yellow line in the middle) graduating from high school showed the steepest improvement from 2001 to 2009 of all race/ethnicity groups, while remaining fairly flat through 2025 before dropping slightly at the end. Both White students (blue line, top) and American Indian/Alaska Native students (orange line, bottom) showed steady decline from the late 2000s through the end of the projections in 2032.
State-level Projections
While the majority of states are projected to see increases in high school graduates from 2001 to 2032, Texas is projected to have almost 150K more high school graduates during that time period, more than doubling the next-highest gaining state (Florida). However, including the years prior to 2014 masks the more prominently discussed trend of sharp decline in the number of high school graduates nationally in the years ahead.
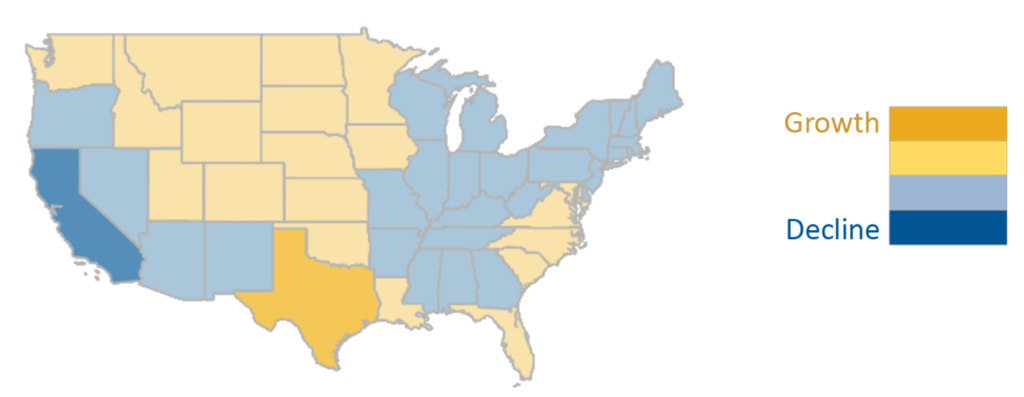
The state-level map below shows that Texas is the only state classified in the highest level of “growth” in the 2016 WICHE report when comparing the projected high school graduate count in 2032 with the data from 2014. Overall, fewer than half of the states (22 out of 51, including the District of Columbia) are projected to increase the number of high school graduates during the 18-year span depicted in the map below. Texas is projected to increase by more than 56,000 high school graduates, while California is projected to decrease by more than 65,000 high school graduates.
So what?
With Texas projected to be the leader in growth of high school graduates in the years ahead, the growing trend of institutions in other states poaching Texans is likely to continue. For the past decade, Texas has been in the top-3 of states with a negative net-migration, where more high school graduates are leaving the state to attend college than Texas is bringing in from other states. In fall 2010, 15,606 non-Texans in-migrated for college, while 26,850 Texans out-migrated for a net-migration of -11,244 (NCES IPEDS Data Explorer, Fall 2010). In fall 2018, the number of in-migration students coming to Texas increased to 16,923, while the out-migration of Texans swelled to 32,276, leaving Texas with a negative net-migration of -15,353 (NCES IPEDS Data Explorer, Fall 2018). The top 5 states for out-migration of Texas students include Oklahoma, Arkansas, Arizona, Louisiana, and Colorado, while California, Colorado, Illinois, Louisiana, New Mexico, and Florida are the top 6 states from which Texas draws first-time-in-college students (Out-of-State Students). Net-migration will continue to be an indicator that higher education stakeholders should watch in the years to come.
Next in the series
The next installment of this blog series will drill-down into direct-from-high-school enrollment data to explore trends in high school graduation at Texas high schools and matriculation patterns to public colleges and universities in Texas.
2 Comments
The blog is a significant step forward. And the graphics show some real promise for educating young Texans in the coming years and genuinely increasing the educational attainment levels in the proper proportions to meet economic and civic demands. The data provide insight into how to ensure Texas grows its comparative economic advantage and, more importantly, offers the best quality of life for its citizens.
A study on the proportions of students who attend out-of-state colleges and universities and return to the State would be valuable in determining if the negative net-migration will be detrimental in the future to the State. More useful would be a study to understand why students leave and what would be required to retain those students in our State’s higher education system.
But, the real concern continues to be the growing percentage of students not enrolling in higher education. Would strategies aimed at preparing more students for higher education earlier by increasing collaboration between higher education and public education be beneficial in genuinely raising the educational attainment levels? Would efforts in creating valuable stackable certificates to associate to baccalaureate to master’s to doctoral degree offerings inspire more Texans to grow by providing a clear pathway for lifetime learners?
I look forward to hearing how these data inspire others in moving the needle.
I appreciate your comments, Paul. You provide much food for thought. I echo your sentiments regarding the data presented in this blog prompting action, which is the primary goal. Looking forward to engaging with you further in these and other important topics.
Comments are closed.